Madrid Spain. — The evolution of the Gross Domestic Product (GDP) —at constant 1997 prices to facilitate comparison— in the different activities of the Cuban economy in 2021 is another source of surprises. The results are presented in Table 1. The first column reflects the variation between 2020 and 2021, and the activities are ordered by the growth registered in 2021 from highest to lowest; while the second column calculates the variation between 2019 and 2021 in each of the activities.
In the first case, the declines in GDP in 2021 were concentrated in the most productive activities in the economy. The sugar industry with a GDP decline of -31.8% was at the head of the losers in 2021. It was followed by the manufacturing industry, with -15.2%, the agricultural sector, with -13.3% , and a little further away Fishing (-8.3%), Commerce (-6.7%) and Electricity supply (-5.3%).
These activities with negative GDP records, to which are added, for the same reason, Culture and sports, import duties, financial intermediation and Exploitation of mines and quarries, represented 36.5% of the economy’s GDP in 2021 and, as a whole, they experienced a drop in GDP compared to the previous year of -8.5%.
On the contrary, GDP increases were recorded in Public Health (14.3%), which was at the head of all activities, Education (9.4%), Transport, storage and communications (5.9%), Hotels and restaurants (5.3%), science and innovation (4.2%), construction (4%), public administration (3.1%). To these were added Business services, Other social and community services.
The aforementioned activities reached the remaining 63.5% of GDP and, as a whole, registered a growth of 7.8% of GDP compared to 2020.
The combined effect of both places the variation in GDP at 1.3% offered by the National Office of Statistics and Information (ONEI) for 2021. But this data ends up being, in itself, of little interest, if it is not taken into account that growth was concentrated in activities dependent on the state budget with a limited carry-over effect on the economy and they did not, in any case, achieve stimulate productive activities that exert greater stimulation on GDP.
The second column of Table 1 reflects the dynamics of the economy since the last year classified as “normal”, which was 2019, noting in this case a drop in GDP of -9.8%, which also shows notable differences between the different activities. The data indicates that many of the activities of the Cuban economy continued in 2021 below the starting levels in 2019.
Unlike the year-on-year comparison, when 2019 was introduced as the starting point, the negative signs increased in number and the magnitude of the variations in absolute terms was also greater.
In this group, the decreases experienced again by the sugar industry (-39.3%), the agricultural sector (-33.7%), and the manufacturing industry (-27.7%) stood out. The influence of the pandemic meant that within the activities of the budgeted sector, Education decreased its GDP since 2019 by -22.1% and hotels and restaurants by -20.5% due to the delay in the arrival of tourists; Commerce fell -18.1%, Electricity supply -11.1% (influence on blackouts), Culture and sports -9.4%. The economic devastation has been particularly intense.
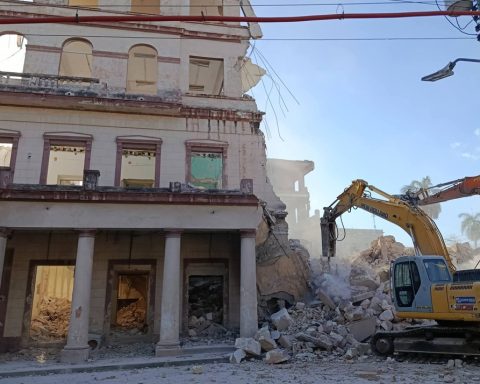
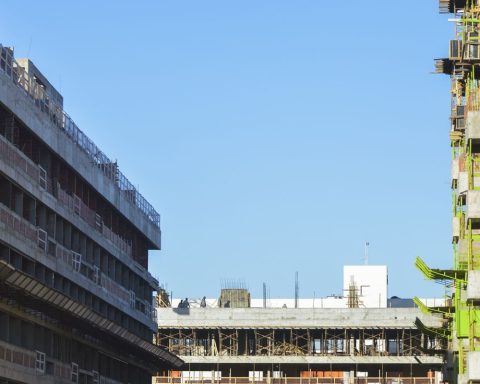
They only registered increases in GDP since 2019 Construction, with 4.6% (where most of the investments in hotels had to be allocated), science and innovation (4.5%), Health (3.1%) , Public Administration (1.2%), and Transport (0.8%) and Business Services (0.4%).

Graph 2 shows the distance that the activities of the Cuban economy must travel in 2021 to reach the levels of 2019. Only six activities of the 19 listed in Graph 2 have reached pre-pandemic levels: construction, science and innovation, public health, public administration, transport, storage and communications, and business and real estate services. All these activities were found in terms of GDP above the level reached in 2019.
At the opposite extreme, 13 activities in the economy had not recovered the 2019 levels in 2021, and even some, such as the sugar industry, lost almost 40% of the 2019 level; For its part, the agricultural sector operated at levels below 34% of GDP in 2019 and the same can be said of the manufacturing industry.
Precisely, the activities that have the greatest traction and impact in terms of generating employment and wealth —linkages, as Díaz Canel says— do not raise their heads two years later.
OPINION ARTICLE
The opinions expressed in this article are the sole responsibility of the issuer and do not necessarily represent the opinion of CubaNet.
Receive information from CubaNet on your cell phone through WhatsApp. Send us a message with the word “CUBA” on the phone +1 (786) 316-2072, You can also subscribe to our electronic newsletter by giving click here.
The post GDP in Cuba: the figures that explain the crisis appeared first on CubaNet.