In 1950, just five years after the end of World War II, global emissions jumped from 4 billion tons of carbon dioxide a year to 6 billion.
But in 1989 it was already 22,000 million tons, almost four times more. In 2019, the most recent data, the world issued 36.400 millions tons of this gas.
The reduction of greenhouse gas emissions will be the main theme of COP26, the UN climate conference that takes place from October 31 to November 12 in Glasgow, Scotland.
At this conference, 200 countries must present their plans to cut emissions until 2030.
From where proare the emissions coming?
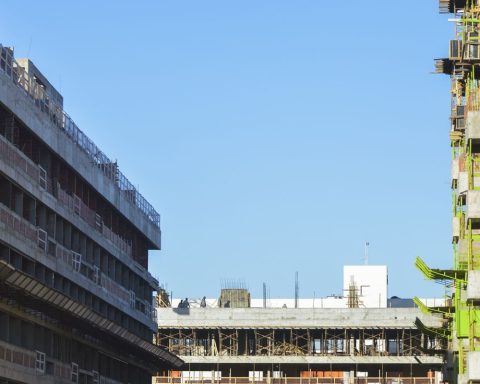
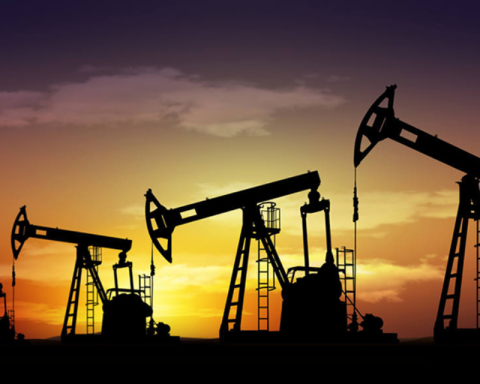
About 86% of the carbon dioxide emissions in the world come from the burning of fossil fuels for the production of energy and materials.
The first century of industrialization was dominated by the burning charcoal, while at the end of the 19th century, emissions by oil and natural gas.

At the end of the 20th century, emissions from cement production and “flaring” (a form of combustion of flammable gases used in industry) began to be significant.
The remaining 14% comes from changes in land use, especially deforestation and forest burning.