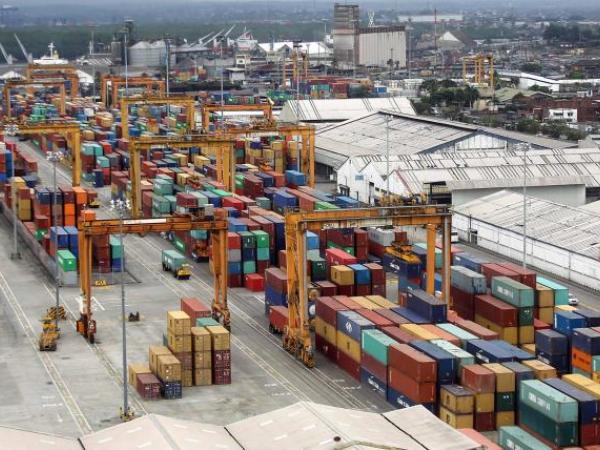
The value of Brazilian exports grew 31.4% in January and was led by commodities, whose volume rose 17.4%, against 6.8% of non-commodities, informed the Brazilian Institute of Economics of Fundação Getulio Vargas (Ibre /FGV), by disclosing the Foreign Trade Indicator (Icomex).
Commodities accounted for 63% of the total value exported by the country, while non-commodities accounted for 90% of imports. In the case of prices, exported commodities increased by 13.6%, lower than the 18% registered by non-commodities.
By sector of activity, there was an increase in the volume exported from agriculture (91.3%), followed by the manufacturing industry (16.3%), while the mining and quarrying industry showed a decrease of 13.4%. Export prices increased by 30.1% in agriculture and 20.1% in the manufacturing industry, with a reduction of 2% in mining and quarrying.
January’s trade balance closed with a deficit of US$ 214.4 million, according to an announcement by the Ministry of Economy. Since 2009, when commodities began to account for more than 50% of national exports and China was the main buyer market, the balance has only been in surplus four times in January. Last year, the balance showed a deficit of US$ 219.8 million. Last January, China lost points to the United States. Commodities are agricultural and mineral products traded on the international market.
China
China continued to lead Brazil’s main export markets, with a 21.5% share, followed by the United States, with 11.6%. In January 2021, however, these percentages were 27.7% for China and 9.5% for the United States. Ibre explains China’s result as a result of the low growth rate of exports (1.9%) to this market, between January 2021 and 2022, compared to the United States, whose high in the same period reached 59.4%. Argentina remained the third main export destination, with a share of 4.8% and growth of 24.2%.
The fall in the value exported to China is associated with the 6.3% retraction in volume exports to that country, between January 2021 and 2022. The price variation for this market was positive (7.8%). For all other markets, exported volumes increased, as did values. Brazilian exports grew 53.2% to the European Union, 33.4% to South America (except Argentina) and 35.9% to Asia, excluding China and the Middle East.
The main product exported by Brazil in January was oil, with a variation of 27.4% in value. China was responsible for 41.9% of purchases of the product, but registered a drop of 17.7%, compared to January 2021. The United States, with a share of 12.6%, increased its purchases by 192%.
The second main exported product was iron ore, which registered a drop in total sales (33.7%) and to China (44.1%).
Soybean exports, the third main national product, increased by 5,224%. For China, whose share of the total was 80%, the variation was 13,990%. This was an expected result, explained Ibre, “since exceptionally last year soybean shipments were delayed”.
In addition to the increase in oil purchases, the United States increased its purchases of beef, which had restrictions in January 2021, by 1,052%, by 33% of coffee and by 340% of iron and steel semimanufactures, says the Icomex report.
imports
Brazilian imports in January this year rose 30.9% in value. In terms of prices, there was an expansion of 32.4% and a decrease in volume of 1.4%, explained by the behavior of non-commodities. The volume index of this aggregate fell by 4.2% and prices increased by 30.8%. Non-commodities explained 90% of imports to Brazil in January.
By sector of activity in imports, the highlight is the extractive industry in terms of volume (86.1%) and prices (110.3%). Among the main selling markets for Brazil, only China and the United States increased the volume imported, in the order of 13.7% and 3.5%, respectively. In the analysis by value, the variation was positive in all markets, but less than 10%, while for China it was 47% and for the United States it was 61.5%. The difference is explained by the variation in import prices (29.1% for China and 55% for the United States).
In terms of imports, Ibre highlighted the 66% increase in the price of fuel oil, the main product on the list, followed by liquefied natural gas (LNG), which grew 531%. In both cases, the United States is the main supplier, accounting for 61.4% of fuel purchases by Brazil and 81.4% of LNG, with growth of 809%.
The Ibre researchers point out that the presidential election scenario in Brazil, associated with the existing tension between the United States, Russia and China, in addition to the appreciation of the dollar against the real, can provoke revisions in the trade balance throughout the year. The only possible certainty for them is that, with the growth forecasts of the Gross Domestic Product (GDP, sum of all goods and services produced in the country) of Brazil below 1%, the imported volume should not decrease and the value will depend on the prices in the world economy. “This, in the event that new effects of the pandemic (of covid-19) are not present”, they warned.


