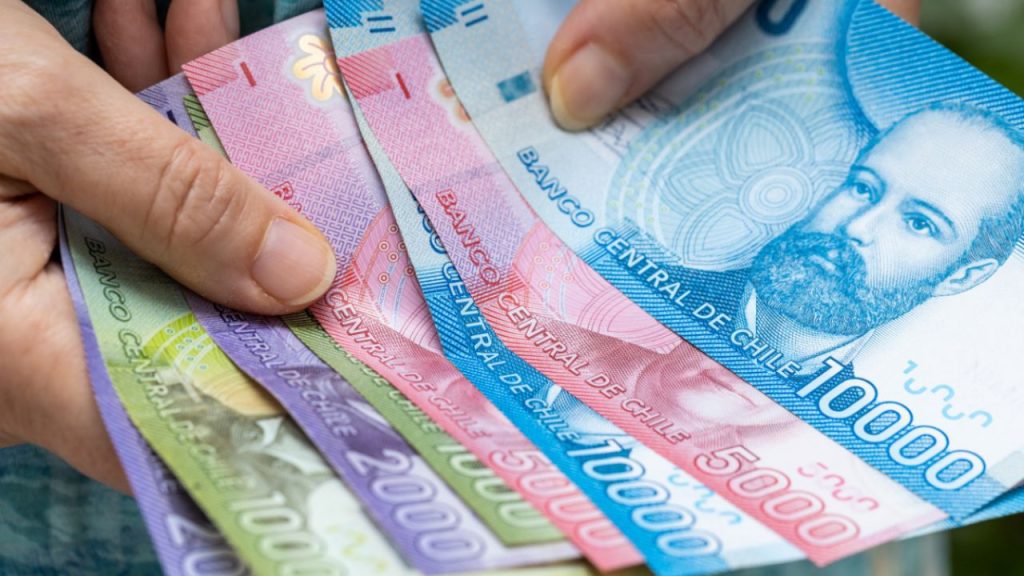
The National Administrative Department of Statistics (Dane) reported that in September, the monthly variation of the Consumer Price Index (CPI) was 0.24%. For its part, The year-to-date variation reached 4.58% and the annual variation reached 5.81%, respectively.
(Read more: The latent risk that remains on the horizon for inflation)
Compared to the previous month’s data, inflation showed a significant reduction, going from 6.12% reported last August to the current 5.81%. According to the statistical entity, the last result is lower than that observed in September 2024, was presented in December 2021, when the CPI reached 5.62%.
As explained by the director of the entity, Piedad Urdinola, the annual behavior of the indicator was explained mainly by the annual variation of the Education division and the effect generated by changes in academic cycles. The figure for this activity then stood at 10.76%.
Below are the items of Restaurants and Hotels, with a variation of 9.08%; Accommodation, water, electricity and gas, with 8.49%; Alcoholic beverages and tobacco, with 6.24%; Health, with 6.16%, and Transportation, with 5.61%.
Now, the category that had the greatest weight in the data was Accommodation, with an annual contribution of 2.58 percentage points (pp).; followed by Restaurants and Hotels, with a contribution of 0.96 pp; Transport, with 0.75 pp, and Food, with 0.53 pp
(Read more: Fewer Colombians would be having difficulties buying food, according to study)
The monthly data
By spending divisions, education was the item that registered the highest monthly variation with 1.93%. According to the director of Dane, this is explained because in the ninth month of the year the prices of education are captured, especially regarding primary and secondary education.
This activity is followed by Restaurants and hotels (0.49%); Health (0.29%); Transportation (0.24%); Accommodation, water, electricity and gas (0.18%); Food and non-alcoholic beverages (0.11%); Clothing and footwear (0.11%); Alcoholic beverages and tobacco (0.07%), and Goods and services for the home (0.03%).
In the case of food, The item changed the negative trend that it had been registering since last month. The adjustment was driven by contributions from the fresh fruit and cocoa derivatives subdivision.
In the ninth month of the year, the spending divisions that contributed the most to the monthly data were Education, with a contribution of 0.08 pp, Accommodation, with 0.05 pp, Restaurants and Hotels, with 0.05 pp, and Transportation, with 0.03 pp
Inflation in the United States
(Read more: 46% of low-income Colombians do not plan vacations due to their finances)
By region
The director of Dane revealed that the cities that registered the highest monthly data were Ibagué, Popayán and Bucaramanga. These three territories reported a monthly variation in September of 0.48%.
In the particular case of Ibagué, the figure was driven by the increase in gas prices (8.14%); meals in table service and self-service establishments (2.53%); fresh fruits (10.49%), water supply (3.26%) and electricity (0.83%).
These are followed by Villavicencio (0.39%), Medellín (0.36%), Neiva (0.36%), Bogotá (0.33%), Other urban areas (0.33%) and Pasto (0.33%). 27%).
At the other end of the data, with a negative variation, are Valledupar (-0.52%), Cartagena (-0.33%), Santa Marta (-0.29%), Sincelejo (-0.25% ), Montería (-0.12%), Barranquilla (-0.12%), Riohacha (-0.02%) and Manizales (-0.01%).
Regarding the annual variation of the CPI, Bucaramanga was the geographic domain with the highest data, with 6.95%. The capital of Santander is followed by Riohacha (6.39%), Valledupar (6.31%), Bogotá DC (6.12%), Florencia (6.07%), Medellín (6.04%), Sincelejo (5.97%), Pereira (5.93%) and Cúcuta (5.92%).
(Read more: In four years, spending on voluntary health plans has increased 68%)
Inflation by income levels
The Dane report shows that, in the monthly variation by income levels in September, the highest figure was obtained by high-income households, with 0.37%. Next were the measured class (0.24%), the vulnerable population (0.09%) and poor households (0.09%).
In the annual variation, it was found that, again, the highest variation was found in high-income households, with 5.98%. This data is followed by those obtained by middle class households (5.81%); vulnerable (5.58%) and poor (5.55%).

Inflation
How did the strike affect you?
At the beginning of September, several blockades were recorded in the national territory as a result of the discontent generated by the increase in diesel (ACPM). The trucker strike, which lasted six days, came to an end after the Government and the transporters reached an agreement regarding adjustments in the rates for this fuel.
There has been talk from several fronts about the impact that this event could have on the inflation results for the ninth month of the year. However, as explained by Dane, The data to analyze the possible effects on prices are very limited.
According to the director of the statistical center, it must be taken into account that the entity collects the information from the first business day to the last business day of the month to generate the report. Added to this is that the strike, in terms of duration, was short.
Urdionola also highlighted that “It has already been commented, on the other hand, that this index measures price variations without being able to infer the reasons or without having a causal effect of those changes that we find in the field and for that reason it is not possible for us, from the measurement of the CPI, determine the exact or quantifiable effect of unemployment within the variations published this Monday”.
(See: Economy in Colombia is growing by inertia and without a clear catalyst)
PORTFOLIO


