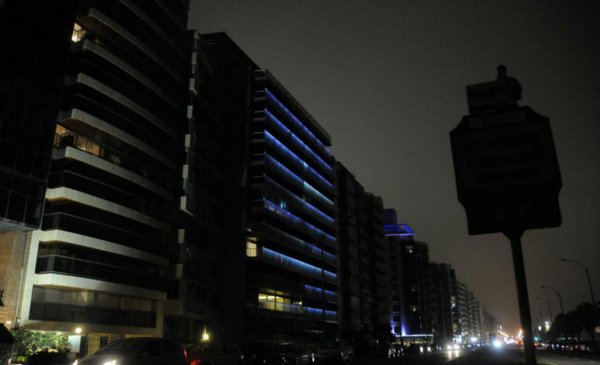
Are there more power outages? Are they longer than usual? To have an approximation to the answer it is useful to consult what the numbers say about the cquality of service. There is information about the cutoff times and cutoff frequency in Montevideo and in the interior of the country.
The UTE data that incorporates information from all the company’s clients show that In 2022, and until August, users had an average of 3.5 outages, and the number of accumulated hours they spent without electricity amounted to 6 hours.
To date, both values are within the service quality goals established for this year, which are 5.5 average interruptions per client, and 9.8 average hours for the cut-off timebased on data accessed The Observer.
These goals are changed every year and are built based on internal efficiency requirements of UTE, and service quality indicators of the Regulatory Unit for Energy and Water Services (Ursea).
Comparison with last year
For its part, comparison with what happened last year shows that the clients had until August a total of 3.2 cutsthat is, a value slightly lower than that of 2022. In the historical series there are only two years with records similar to or better than those of August 2021.
Meanwhile, the duration of the cuts that occurred in the first eight months of 2021 had been 4.9 hours of interruption, also lower than the accumulated 2022 (6 hours). In any case, this value is below what it was until August of other years such as 2019, 2018, 2016, 2014 and 2013.
In dialogue with The Observerthe president of UTE, Silvia Emaldi, explained that during 2022 and taking into account the multiple meteorological effects that directly impacted the electrical infrastructure, there have been interruptions “that have had expected values” on average, within the ranges defined for the year.
“There is a climatic effect of strong storms, of strong winds that is inevitable here and in any part of the world. This year in particular we had a moment of affectation in the service in January basically, because there was a combination of fires in some areas, wind storms in others, and in Montevideo we had floods. (…) No one can guarantee that due to an installation problem or due to a work, the service will be had with zero affectation in the year”, Emaldi stated as an example.
Secondly, If you look at what happened in all of 2021, the average customer was affected by 4.9 outages, which meant that the growing trend recorded since 2014 with values between 5 and 6 outages was reversed. Something similar happened with the time of cuts (7.6 hours)which continued the continuous improvement shown by the indicator since 2018 and registered in 2021 the lowest value of the last decade.
The graphs included in this note show annual averages. Some customers had more outages and suffered more hours of outage and others less. For example, in the country interiorthe accumulated average outage time in the year is historically usually greater than in cities, as is the frequency.
This is explained because in rural areas there are factors that cause more failures and also longer replacement times, due to distances and access difficulties, among other points. If it is taken into account that most of the clients live in the cities, the averages are closer to the lowest values.


