Access to housing became more expensive last year for Uruguayans. LReal estate prices increased slightly both for rent and for purchaseaccording to the latest report on the real estate market of Free market.
The 2021 closing survey revealed that what increased the most on average were house rentsalthough “not all the neighborhoods of the capital had a similar behavior”.
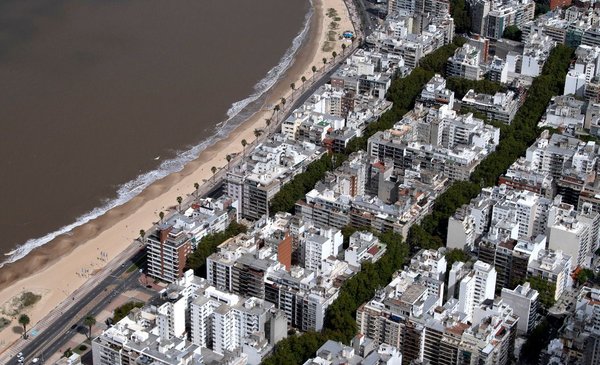
In Montevideo, Carrasco, Pocitos and Malvin were the neighborhoods with the highest values per square meter, while in the whole country the most expensive apartment was Maldonado.
On the other hand, the supply of rentals in Montevideo and Ciudad de la Costa decreased to pre-pandemic levels. With the outbreak of the coronavirus in the country, one of the consequences in the real estate market had been the growth of rentals in relation to sales as a proportion of total operations.
Mercado Libre prepared a series of 19 interactive charts that investigate rental and sales prices, differences between neighborhoods in the capital and coastal cities, and how prices have changed in pesos and dollars, among other data.
In addition, he published a Montevideo map that allows the user to perch on each neighborhood to know the average cost of rentals in pesos, the sales value in dollars per square meter and the gross annual return. There’s also a map of Uruguay by department which gives the value per square meter of the houses and they can be seen here (on slides 17 and 19 each).
